How to Use Home Page Statistics in Web Console - AnySecura Manual
Welcome to your network's command center. The AnySecura Web Console Home page provides a real-time statistical snapshot of your entire environment, from running clients to key activity logs, all updated from midnight to the present moment.
This dynamic dashboard is your starting point for deeper investigation. By simply double-clicking any statistic, you'll be taken directly to the corresponding detailed log view within the AnySecura console, turning high-level awareness into actionable insight.
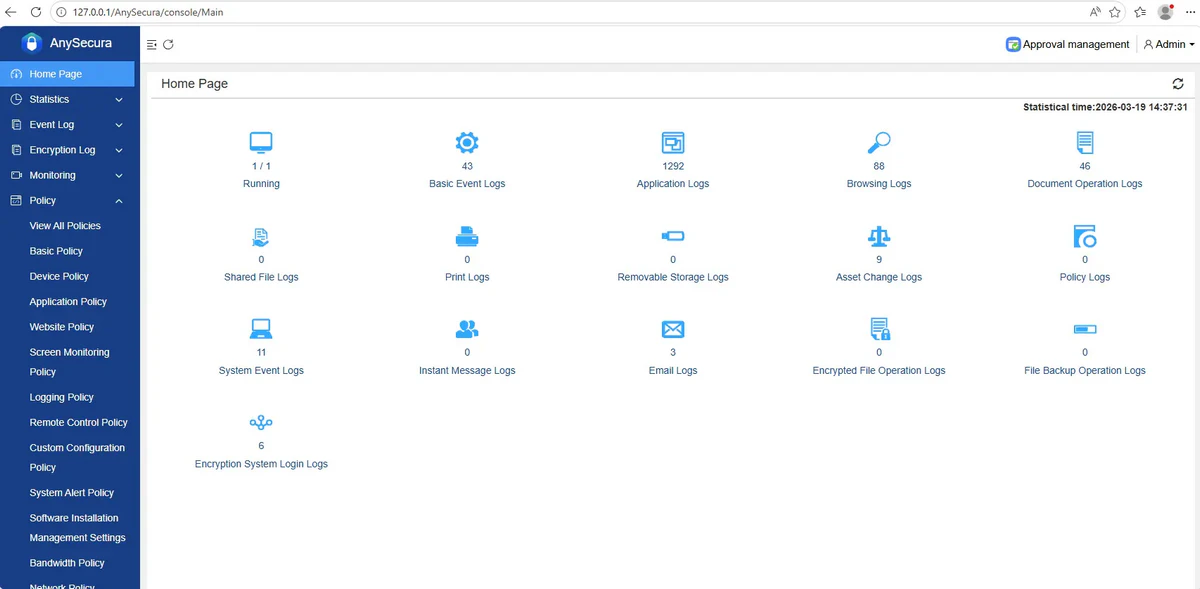
The Home page displays statistics for various logs across the entire network. The data includes: number of running clients, basic event logs, application logs, web browsing logs, document operation logs, shared document logs, document print logs, and removable storage logs.
The statistical time range is from 00:00 of the current day to the time shown in the top-right corner of the interface.
Double-clicking a statistic type icon will navigate to the corresponding detailed log view.