If your team builds or maintains software, you already know how important it is to spot problems before users do. Application monitoring tools help you track performance, errors, slow features, and unexpected behavior, all in real time.
This guide breaks down the top 10 application monitoring tools, their best use cases, and what makes each one stand out. Whether you're running microservices, mobile apps, or internal business systems, you'll find an option that fits your team's workflow and scale.
You may also feel interested in: Top 5 Network Monitoring Software 2026 | Pros & Cons
Top 10 Application Monitoring Tools in 2026
Quick Overview: Who Should Use Which Tool?
| Tool | Best For | Price |
|---|---|---|
| Datadog | Cloud-native DevOps teams and large tech companies | High |
| New Relic | Engineering teams prioritizing flexibility and cost control | Medium |
| Dynatrace | Large enterprises and mission-critical systems teams | Very High |
| Prometheus | Budget-conscious SREs and operations engineers | Free (Open Source) |
| Grafana | Teams needing to consolidate diverse data sources | Free (OSS) / Medium (Cloud) |
| AppDynamics | Large financial, e-commerce, and enterprise organizations | Very High |
| Jaeger | Development & SRE teams managing microservices | Free (Open Source) |
| Elastic APM | Users already running the ELK stack (Elasticsearch/Kibana) | Free (Self-hosted) / Medium–High (Elastic Cloud) |
| Splunk APM | High-volume financial or tech companies requiring full-fidelity data | Very High |
| Sentry | Software developers and QA teams | Low–Medium |
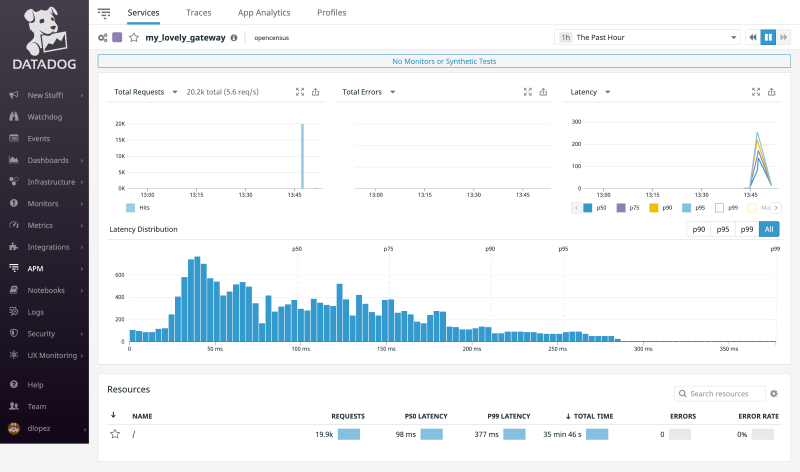
Datadog
Datadog positions itself as a cloud-native, full-stack observability platform designed for organizations that run modern, distributed applications. Its application monitoring offering integrates naturally with metrics, logs, traces, real-user monitoring, synthetics, and extensive cloud infrastructure data.
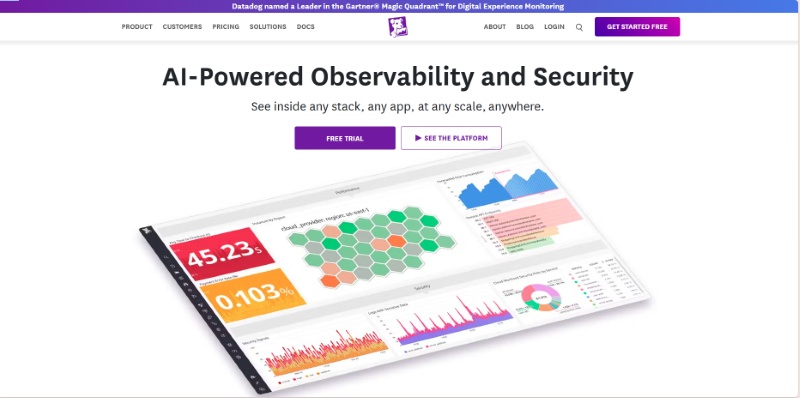
Datadog's core differentiation is its Unified Platform approach, consolidating metrics, logs, traces, and security monitoring into a single, cohesive SaaS product. This unification is powered by the highly efficient Datadog Agent and supported by 450+ out-of-the-box integrations, making it the premier choice for companies operating complex, cloud-native stacks (especially those heavily invested in Kubernetes and multi-cloud). Its strength lies in its ability to correlate data types instantly within one interface.
However, Datadog's richness comes with significant challenges, the first of which is cost. As companies grow, the combination of trace volume, log ingestion, custom metrics, and synthetic tests can quickly become expensive. Many organizations report that their Datadog bill grows faster than their infrastructure bill unless they proactively manage sampling strategies, logging policies, and retention periods. Logs in particular are a common source of cost spikes, because Datadog charges for both ingestion and indexing, and Kubernetes environments tend to generate large amounts of log data by default.
 Choose Datadog if you need:
- Kubernetes, serverless, or complex microservices
- Best-in-class unified observability.
- Minimal setup time.
- Rich dashboards & integrations.
- A mature vendor with broad support.
Datadog is not ideal if:
- Tight budget: Datadog is one of the priciest application monitoring tools.
- High log volume: Costs can spike quickly with Datadog's proprietary pricing.
- Open-source preference: Datadog's agents are closed and not very transparent.
- Simple architecture: Likely overkill; more affordable options will do the job.
New Relic
New Relic is essentially the smart, flexible choice for modern teams that want to monitor everything but hate being locked into one vendor. The company wants you to think of them as the platform that truly embraces open-source standards, meaning you can bring data from any tool you want. Their application monitoring is built right into their main system, where they gather all your key monitoring data, like performance metrics, system events, user logs, and tracing data, and put it all together in one powerful database.
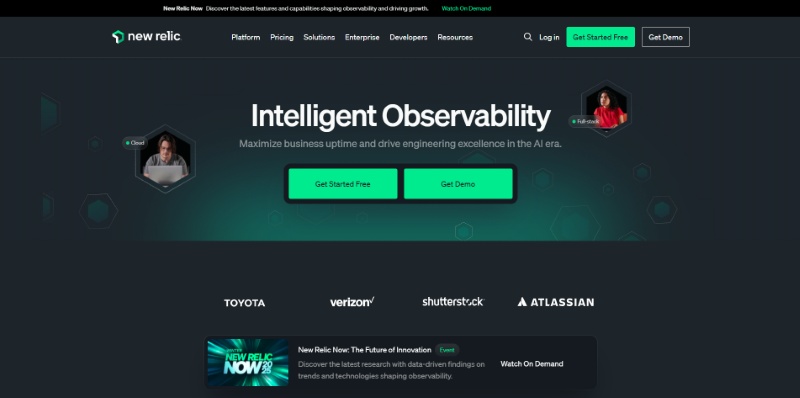
The biggest thing that makes New Relic stand out is its pay-as-you-go pricing model and its unified database. Instead of paying a fixed fee per server or container, you pay based on the amount of data you send to them, which gives you more control over your costs. Since they strongly support OpenTelemetry, it's easy to plug in all your custom or third-party data. Having all your data types in one place also means you can ask very complex questions about your system's health using their special query language (NRQL).
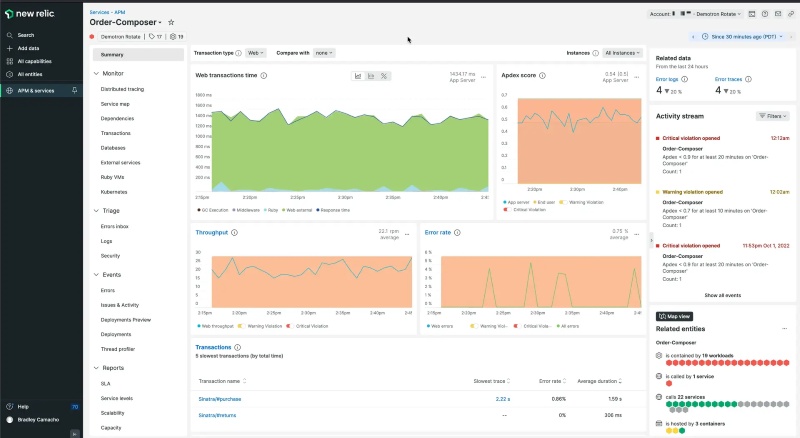
However, New Relic isn't always easy to start with. The main problem is that it's simply overwhelming when you first look at it. They offer so many features and tools that new users often feel lost, and you really have to spend time learning their specialized query language (NRQL) to get the best results. Although the pricing is flexible, if your application suddenly creates huge, unexpected amounts of data, like a traffic surge or a logging error, your bill can still shoot up dramatically, which defeats the purpose of flexible pricing.
Choose New Relic if you need:
- Flexible data-based pricing: You prefer paying for data volume, not per host.
- Open standards: You want OpenTelemetry support and reduced vendor lock-in.
- Unified querying: You need one query layer across metrics, logs, and traces.
New Relic is not ideal if:
- You dislike learning new tools: NRQL is required for advanced analysis.
- You need predictable costs: Usage-based pricing may fluctuate with data spikes.
- You want simplicity: The platform's broad feature set can feel overwhelming at first.
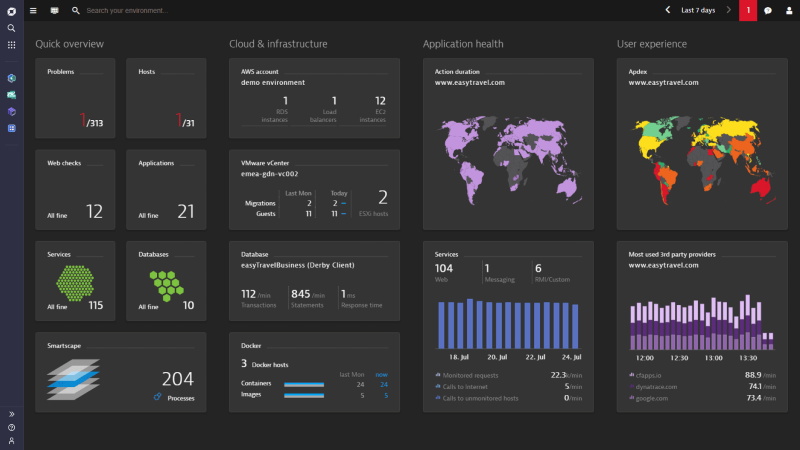
Dynatrace
Think of Dynatrace as the highly automated, almost self-driving monitoring system built for huge companies where system downtime is a disaster. It doesn't just watch your app; it practically runs the diagnostics itself. Their core application monitoring is part of a complete suite that monitors everything from the underlying infrastructure to the final user experience, all managed by artificial intelligence.
Dynatrace's key difference is its AI brain (called Davis®) combined with its full-visibility tracing (PurePath®). You install a single piece of software (the OneAgent) and it automatically starts watching everything without skipping any data, no sampling at all. The Davis AI takes this perfect data and, instead of just telling you something is slow, it automatically figures out the exact root cause of the problem, dramatically cutting down the time your team spends investigating.
But there's a major trade-off for all this automation: it often feels like a "black box." Because the AI is so good at solving problems, it doesn't always show the detailed workings behind its decisions. This lack of transparency can be really frustrating for very experienced engineers who want to have total control over the rules or need to deeply customize the system. Also, because it's a premium product with this kind of top-tier automation, it comes with a premium, high-end price tag.
Choose Dynatrace if you need:
- Automatic root-cause detection: You want AI to pinpoint issues without manual investigation.
- Full, unsampled tracing: You handle mission-critical apps and must capture every transaction.
- Zero-effort setup: You prefer instant, comprehensive monitoring through a single OneAgent.
Dynatrace is not ideal if:
- You're on a tight budget: It's a premium, enterprise-grade solution with higher costs.
- You want full transparency: Its AI-driven “black box” decisions may feel too automatic.
- You prefer open source: Dynatrace relies heavily on proprietary technology.
Prometheus
Prometheus is the free, community-driven monitoring tool that has become the gold standard for tracking system health in the world of containers and Kubernetes. It's the first tool most DevOps teams turn to when they need to keep an eye on their infrastructure metrics, mainly because it's open-source and very powerful for its specific job.
What makes Prometheus special is its open-source nature, its unique way of gathering data (the "pull" model), and its powerful query language (PromQL). Unlike tools that wait for your server to send data, Prometheus actively goes out and "pulls" the performance metrics from your applications. This is perfect for dynamic environments like Kubernetes. Since it's open-source, you have full control, and its query language is extremely flexible for analyzing performance trends.
The biggest practical problem with Prometheus is that it's terrible at holding onto data for a long time or scaling easily. It wasn't designed to be a massive, centralized database. If your system is huge or if you need to look at data from six months ago, you are forced to add complex, separate tools (like Thanos or Cortex) on top of it. This makes the setup and long-term maintenance much harder and requires a lot of specialized engineering time.
Choose Prometheus if you need:
- Free, open-source metrics: Ideal if you want a fully open, cost-free monitoring stack.
- Kubernetes-native monitoring: It's the de facto standard for K8s metrics collection.
- Advanced metrics analysis: PromQL offers powerful, flexible querying for time-series data.
Prometheus is not ideal if:
- You want an all-in-one solution: Prometheus handles metrics only—logs and traces require extra tools.
- You need long-term retention: It can't efficiently store large historical datasets without external storage systems.
- You have limited engineering resources: Running it at scale with HA setups demands significant expertise.
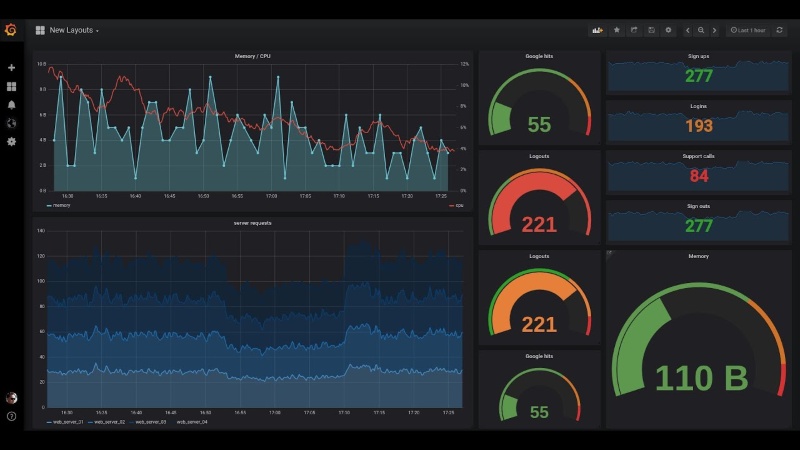
Grafana
Grafana is best described as the "universal TV screen" for all your monitoring data. It doesn't actually collect any data itself; its purpose is to be the beautiful, customizable front end that pulls information from almost any data source you already have and displays it all in one place.
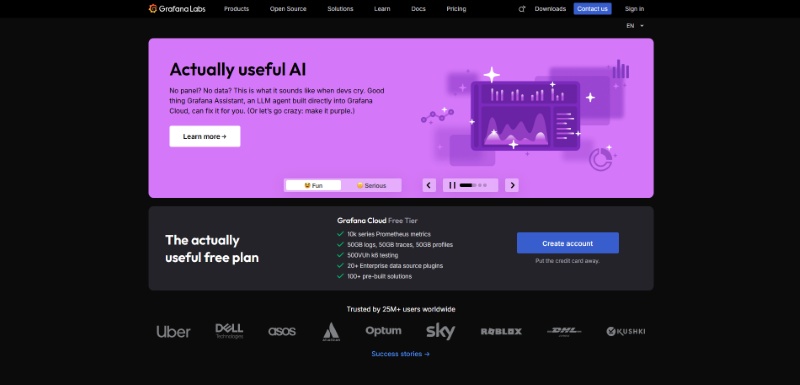
Grafana's killer feature is its ability to connect to basically anything and its amazing flexibility in building dashboards. Thanks to a huge library of plugins, it can pull metrics, logs, and trace data from dozens of different backends (like Prometheus, Elasticsearch, or even SQL databases). This allows you to create highly tailored, sophisticated dashboards that unify all your disparate data sources into a single, clean visual interface.
However, Grafana's biggest headache is the resulting "dashboard mess" that happens when a team grows. Because it's so easy to build a new dashboard, teams quickly end up with hundreds of disorganized, duplicated, or forgotten screens. Managing these dashboards as code is also often clunky because the native export files are large, complex, single-file documents (JSON), which makes version control and management a pain.
Choose Grafana if you need:
- Universal visualization: A single UI to display data from Prometheus, Elastic, SQL, and more.
- High customization: Full control over dashboard design and layout.
- Open-source flexibility: A free front-end that adapts easily to different data backends.
Grafana is not ideal if:
- You need data collection: Grafana only visualizes data—it doesn't collect or store it.
- You lack dashboard governance: Without controls, dashboards can quickly become cluttered and inconsistent.
- You need advanced alerting: Visualization is its strength; alerting is more limited than dedicated monitoring tools.
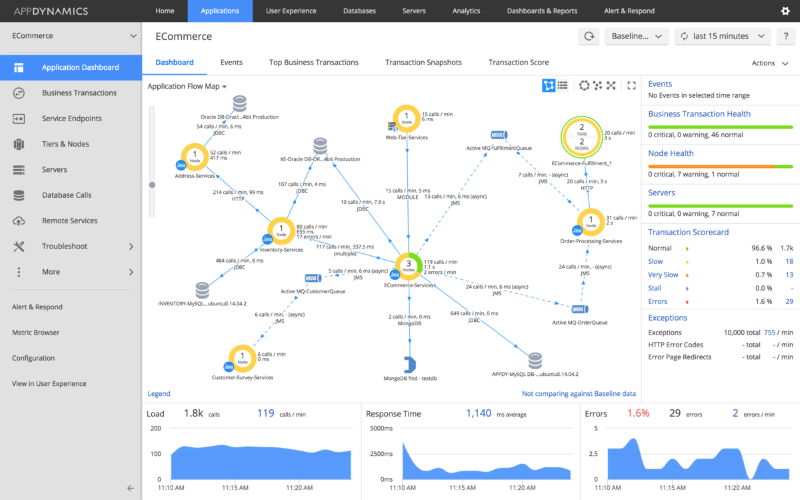
AppDynamics
AppDynamics is the monitoring tool built specifically for big corporations where technology directly affects sales and revenue. Its focus isn't just on system speed; it's on how technical performance directly impacts the customer's experience and, ultimately, the business bottom line.
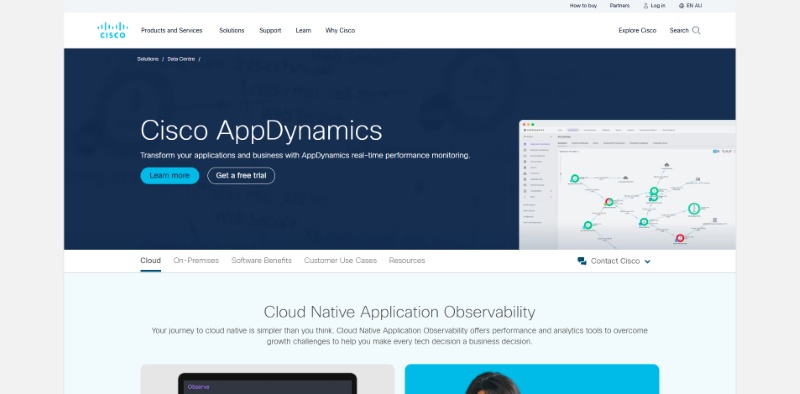
The most important feature of AppDynamics is its focus on "Business Transactions" and its smart alert baselines. It automatically tracks every single step a customer takes (like a login or a checkout process) across all your services. It also learns what "normal" performance looks like for each of those steps, so it only sends you alerts when something is truly broken and affecting the business, cutting down on useless noise.
Despite its power, AppDynamics struggles significantly with being flexible in newer, faster cloud environments. It was designed primarily for older, multi-tier enterprise applications. Trying to install and configure its specialized agents into rapidly changing container environments like Kubernetes is often a tedious and complicated process, which makes the initial setup much slower and harder than using tools built purely for the cloud.
Choose AppDynamics if you need:
- Business transaction visibility: You want to connect app performance directly to revenue and customer journeys.
- Smart baseline alerts: You prefer automatic learning of “normal” behavior to cut down alert noise.
- Enterprise application monitoring: You manage large, legacy, or multi-tier systems common in traditional enterprises.
AppDynamics is not ideal if:
- You run only modern cloud apps: Deployment in dynamic Kubernetes environments is often slow and complex.
- You're on a tight budget: It's an enterprise-grade tool with high licensing costs.
- You want quick, low-effort setup: Its configuration requires more work than cloud-native application monitoring tools.
Jaeger
Jaeger is the go-to open-source tool for solving slow request problems in complex microservices. It focuses entirely on "distributed tracing," which is the process of tracking a single user request as it bounces between dozens of different backend services.
Jaeger's main advantage is its complete focus on visualizing the request path using open standards. It gives you the necessary tools to clearly see every service a request hits and exactly how long each service takes, laid out in a clean, visual timeline. This makes it instantly clear whether a delay is caused by your database, an API gateway, or a specific function call.
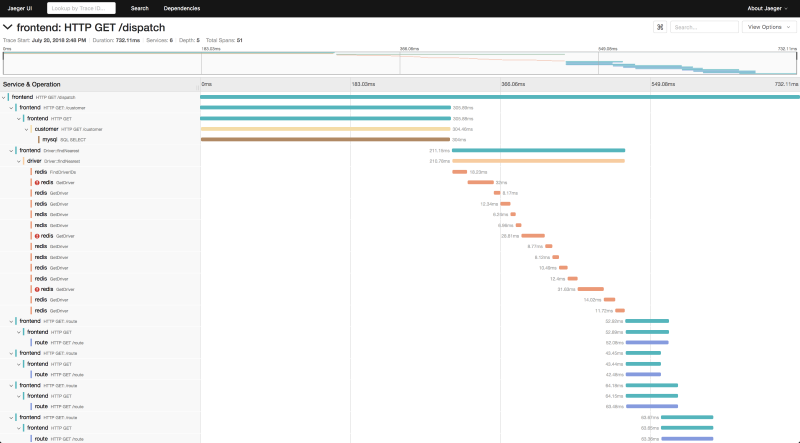
The biggest problem with Jaeger is that it's only one part of the solution; it doesn't do everything. It gives you the tracing data, but you still need to set up and manage entirely separate tools for tracking metrics (like CPU or memory) and for collecting log files. This forces your team to manage a fragmented and complex monitoring setup that requires continuous maintenance for three different systems.
Choose Jaeger if you need:
- Open-source distributed tracing: A free way to analyze latency across microservices.
- Clear request flow visualization: Timeline views that highlight slow service calls instantly.
- A focused tracing tool: A simple solution dedicated to mapping request paths end to end.
Jaeger is not ideal if:
- You want an all-in-one platform: Jaeger only handles tracing; logs and metrics require other tools.
- You have limited engineering capacity: You must deploy, scale, and maintain all backend services yourself.
- You need fast onboarding: Full tracing requires instrumenting each microservice, which takes development effort.
Elastic APM
Elastic is the logical choice for any organization that is already heavily invested in the Elastic Stack (ELK), which includes Elasticsearch and Kibana. It offers an easy way to start monitoring application performance without introducing any new databases or tools.
Elastic's strongest point is its deep, seamless integration with the existing ELK search infrastructure. It stores all the application traces, logs, and system metrics right inside the same Elasticsearch cluster. This means you can use the same powerful search queries you already use for logs to instantly cross-reference and analyze performance issues, saving you the time and effort of learning a new system.
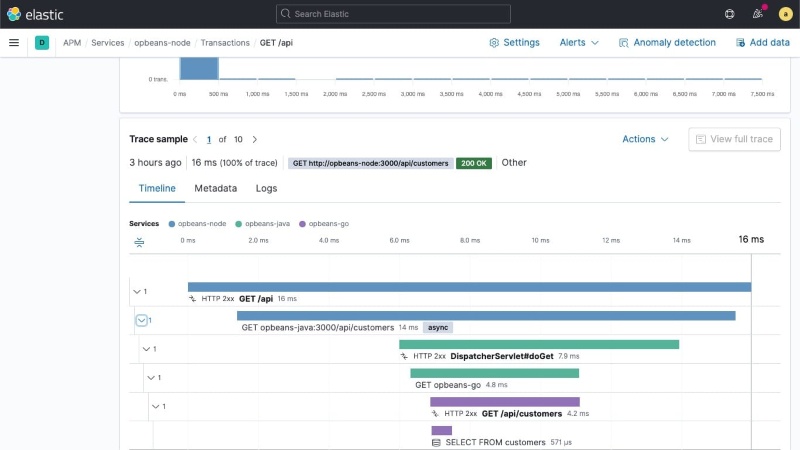
The serious downside, however, is the huge amount of effort required to keep the underlying Elasticsearch cluster healthy. As you send more and more data, managing the scaling, partitioning, and performance of that giant search cluster becomes a major, continuous job. This operational headache often distracts SREs from application problems because they have to spend so much time just keeping the data platform running smoothly.
Choose Elastic APM if you need:
- You already use the ELK Stack: Ideal if you want to build on existing Elasticsearch infrastructure.
- Unified search across application monitoring, logs, and metrics: Kibana gives you one powerful query interface for all data types.
- Flexible deployment options: Works well both self-managed on-premise and on Elastic Cloud.
Elastic APM is not ideal if:
- You want minimal maintenance: Managing and scaling Elasticsearch requires continuous operational effort.
- You prefer simple SaaS: Even with Elastic Cloud, you still need to understand cluster behavior and performance.
- You need automated root-cause analysis: Elastic focuses on data exploration, not AI-driven diagnostics like Dynatrace.
Splunk APM
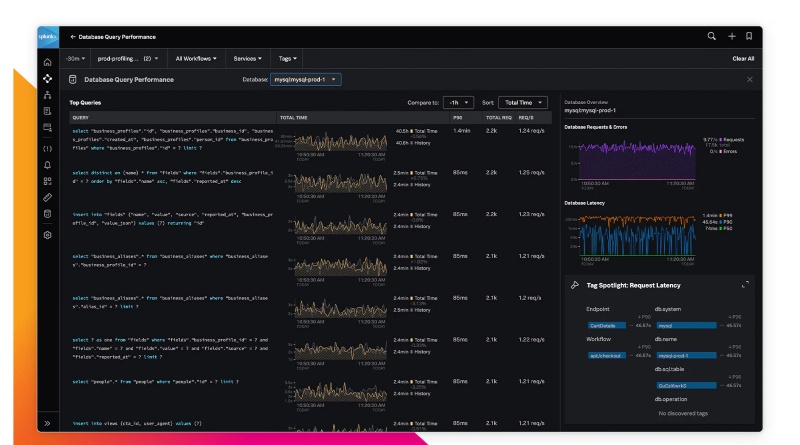
Splunk APM is the tool for huge organizations with massive data volumes that absolutely cannot afford to lose any data. It's built for real-time analysis and focuses on guaranteeing that every single transaction is recorded and watched.
Splunk APM's critical advantage is its "No Sampling" full-fidelity tracing and its instant analytics. It promises to analyze 100% of all data, which is vital for finding rare bugs that other tools might miss by only looking at a fraction of the transactions. Furthermore, it processes this huge amount of data in real-time, allowing for instant alerts and deep analysis based on any detail or "tag" you want to search.
Despite its technical brilliance, the biggest hurdle for Splunk APM is the difficulty in learning its specialized querying language (SPL). To use the platform's amazing power for sophisticated data analysis, your team must master the complex Splunk Processing Language. This steep learning requirement can be a major roadblock, limiting the number of developers across the company who can actually perform deep debugging.
Choose Splunk APM if you need:
- Full-fidelity tracing: You must capture 100% of transactions to detect rare, high-impact issues.
- Real-time analytics: You rely on instant dashboards and alerts instead of batch-processed data.
- Cloud-native scale: Your system ingests massive data volumes and grows rapidly.
Splunk APM is not ideal if:
- You're on a tight budget: Full-fidelity tracing is costly and aimed at very large systems.
- You want simplicity: The platform's depth can be overwhelming for smaller teams.
- You avoid proprietary languages: Advanced analysis requires learning Splunk's SPL query language.
Sentry
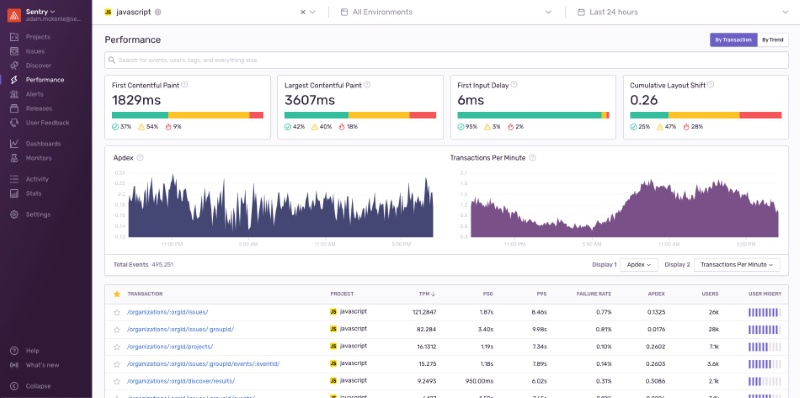
Sentry is the developer's best friend for catching errors and crashes. It is primarily an error-tracking tool built for development and QA teams, focusing on helping them instantly find, prioritize, and fix bugs across all their codebases (web, mobile, backend).
Sentry's key differentiating feature is its deep focus on the code and the developer's workflow. When an error happens, it immediately links that crash to the exact line of code, the developer who wrote it, and the release version it appeared in. This instant contextualization, paired with integrations into tools like Git and Jira, makes the entire process of debugging and pushing a fix incredibly fast.
The main functional problem with Sentry is that it's too enthusiastic about finding errors, which causes huge amounts of noise. Because it captures everything, including low-priority warnings, teams quickly suffer from alert fatigue. This makes it difficult to trust the system to only alert on truly critical problems, meaning teams risk missing a severe, high-impact issue because they've learned to ignore the constant stream of low-priority pings.
Choose Sentry if you need:
- Developer-centric workflows: Direct integration with Git, Jira, and CI/CD for seamless error tracking.
- Instant error context: Every crash links to the exact code line, release, and stack trace.
- Strong frontend/mobile monitoring: Excellent for JavaScript apps and mobile crash reporting.
Sentry is not ideal if:
- You need stable, noise-free alerting: It can generate excessive notifications and cause alert fatigue.
- You need infra-level monitoring: Sentry focuses on app errors, not CPU, network, or server metrics.
- You want full observability: It excels at error tracking but lacks full application monitoring and infrastructure depth.
AnySecura: See the Human Actions Behind Application Issues
Most application monitoring tools focus on the technical side of performance: which features slow down, where errors happen, and when the system starts behaving differently. But they can't tell you whether these issues were triggered by a person, for example, someone changing a setting, deleting the wrong data, or clicking the wrong button during routine work.
This is where AnySecura fits in as a perfect complement.
Instead of monitoring app performance, it monitors and control human actions inside your internal systems. AnySecura shows you who did what and when, so when something breaks, you don't have to guess whether it was caused by a system bug or a risky action made by a team member.
By adding this layer of visibility, AnySecura helps teams:
- Trace the issue back to exact user operations (e.g. “user X deleted file Y at time Z”)
- Replay what happened on screen to check if it was a misuse or mis-click rather than system error
- See if network or external device actions (USB, file transfer) had anything to do with the issue
- Quickly narrow down root cause, human mistake or suspicious action, without hours of blind searching
If your team relies on application monitoring tools but still struggles to understand the human side of incidents, AnySecura can fill that gap and make your monitoring stack more complete.
FAQs about Application Monitoring Tools
Q1 Are application monitoring tools only for big companies?
No. Modern application monitoring tools scale from small startups to large enterprises. Even small teams benefit from early visibility into errors, performance issues, and user experience.
Q2 How do I choose the right tool?
Pick based on your needs: Datadog for cloud-native stacks, New Relic for flexible pricing, Dynatrace for enterprise automation, Prometheus/Grafana for open-source, and Sentry for error tracking. Match the tool to your team size, budget, and tech stack.
Q3 Do monitoring tools slow down my app?
Most application monitoring tools add very minimal overhead (usually 1–5%). Modern agents are optimized, and the visibility you gain far outweighs the tiny performance cost.
Conclusion
Picking the best application monitoring tools isn't about finding the most complex platform, it's about choosing the one that helps your team work smarter, catch issues faster, and deliver a reliable experience to your users. Each tool on this list excels in different scenarios, so focus on what your team truly needs: deeper visibility, easier troubleshooting, or better performance insights.
And if you want to go beyond performance data and understand the human actions behind system changes or incidents, a tool like AnySecura can be a powerful addition to your monitoring stack. Together, they give you a complete picture of how your applications behave, and why.