How to Use the Console Interface in AnySecura | User Guide
Welcome to the AnySecura console! This guide will help you become familiar with the central hub for managing your security environment. You'll learn the purpose of each key area, from the main navigation menus to the dynamic data panels.
Understanding this layout is your first step toward efficient administration. We'll also explain how to interpret the status icons for your computers and users, giving you a clear, real-time view of your entire network's activity.
After logging in, the console displays the following interface view:
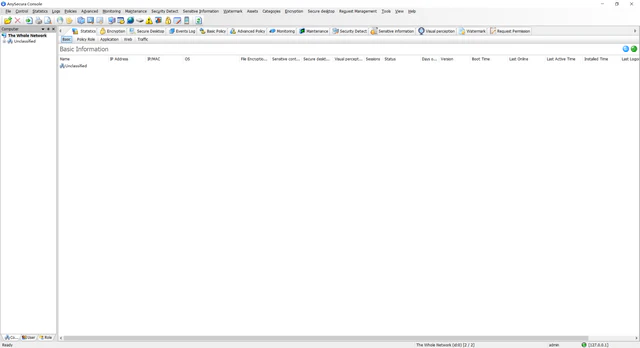
The console interface consists of the following areas:
| Interface Area | Description |
|---|---|
| Menu Bar | Contains all system menus and serves as the entry point for each function. |
| Toolbar | Provides quick access to frequently used functions. |
| Computer Panel | Located on the left, displays all client-installed machines and group info. |
| User Panel | Located on the left, shows all logged-in users on client machines and groups. |
| Main Navigation Menu | Below the toolbar, allows quick access to main functions. |
| Sub-navigation Menu | Supplements the main navigation for direct access to specific features. |
| Function Button Area | Below the sub-navigation, includes the current function title and buttons on the right. |
| Data Display Area | Core view of the system where all data is displayed. |
| Chart Panel | Available in statistics functions, displays graphs. |
| Query Panel | Present in statistics, logs, instant messaging, and mail records; supports common query conditions. |
| Property Panel | Found in policy control functions, used to set policy attributes. |
| Status Bar | At the bottom, shows the current function's status. |
Computer Panel Icon Meanings
| Icon | Color | Meaning |
|---|---|---|
| Bright Blue | Client module is running normally | |
| Gray | Client module not running; machine may be off, offline, or blocked by firewall | |
| Dark Gray | Client module has been uninstalled | |
| Bright Blue+Clock | Client module running, but user is away |
User Panel Icon Meanings
| Icon | Color | Meaning |
|---|---|---|
| Bright Blue | User's client module is running normally | |
| Gray | User's client module not running; user may not be logged in |
Common Log Attributes and Query Conditions
In log records (including event logs, email logs, and instant messaging logs), the following common fields are included:
| Field Name | Description |
|---|---|
| Time | The precise timestamp of the log entry. |
| Computer | The client machine associated with the log; matches the name displayed in the Computer Panel. |
| User | The user responsible for the log entry; matches the name displayed in the User Panel. |
For logs and statistical data, the system provides the following common query conditions:
| Query Condition | Description |
|---|---|
| Time Range | Specifies the time period for the query. By default, the end time is the current day and the start time is one month prior, so the default query covers the last month. |
| Click the previous icon to view logs from the prior time segment (day, week, or month depending on the current start and end times). | |
| Click the next icon to view logs from the next time segment, based on the set time range. | |
| Click the reset icon to restore the system's default time range. | |
| Time Type | Predefined in "Category Management → Time Types" as Working Hours, Break Time, and Weekend Time. Administrators can adjust these or create custom time types for queries. |
| Range | Click the button on the right to open the scope selection window, allowing queries for a single computer, a group, or the entire network. |
Note:
This operation only changes the password for the currently logged-in administrator account, which is displayed in the first line of the dialog.
The new password takes effect once it is validated by the server module.