How to Use the Reporting Console in AnySecura | User Guide
This guide will help you master the AnySecura Reporting Console, starting with how to access it and navigate its main interface. You'll get comfortable with the layout, from the navigation bar to the central data display area.
You'll then learn to interact with your security data, customizing charts and lists to visualize trends and drill down into details. Finally, we'll cover practical utility functions like exporting reports and printing, empowering you to share insights effectively.
30.2.1 Logging into the Reporting Console
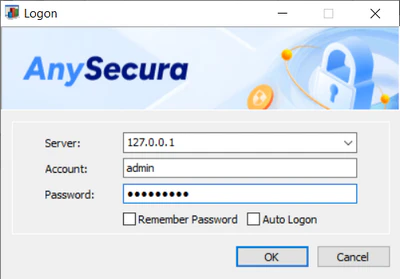
Log in to the console and select "Tools -> Login Reporting System" to launch the reporting console.
The reporting console interface includes:
| Interface Area | Description |
|---|---|
| Menu Bar | Contains all system menus and serves as the entry point for each functional window. |
| Toolbar | Includes commonly used functions. |
| Navigation Bar | Located on the left side of the window, showing all periodic reports, query reports, and group information. The system predefines statistical and trend reports for all report types, organized by report type. |
| Data Display Area | The core view of the system, where all data is displayed. Divided into three sections: |
| Query Bar | Provides query criteria. |
| Chart Area | Located below the query bar, displays statistical charts of query results. |
| Data Grid | Located below the chart area, shows detailed query result data. |
After logging into the reporting console, the data display area defaults to the homepage, which shows statistical information for specific logs across the network.
The statistics include: printed pages, sent email sizes, files written to removable disks, and uploaded file sizes. The time range for statistics is from 00:00 of the current day to the time displayed in the top-right corner of the interface. The homepage also displays the 10 most recently generated reports.
30.2.2 Data Display Area
The data display area contains many common elements.
Result View
All reports and query results are displayed in the data display area with charts above and list data below by default. Right-click in the data display area and select "Result View -> Maximize Chart" to show only the chart, or "Result View -> Maximize List" to show only the list data.
Charts
In the top-right corner of a chart, you can select the number of data items to display and switch the chart type. By default, all data is shown, or you can choose the top 5, 10, 20, or a custom number. Statistical reports default to bar charts, while trend reports default to line charts. The chart type can also be changed via the right-click menu.
Right-click and select "Chart Settings" to configure legend items and the number of horizontal axis labels.
Lists
Below the chart, detailed data is displayed in a list format. You can choose which columns to display. Right-click a column header to add or remove data columns.
Detail Information
In each report’s result list, double-click a row or select a row and choose "Details" from the right-click menu to view specific details. For comprehensive data reports containing multiple data types, double-click different cells in a selected row to view the details corresponding to that cell.
Within the detail list, double-click a detail entry to view the specific log record.
30.2.3 Utility Functions
Import / Export
Generated reports and query results, along with their corresponding detail tables, can be exported and saved as electronic documents.
Reports and Query Results
In the data display area of periodic or query reports, right-click and select "Export -> Export Statistical Report" to export the current statistics, including charts. Right-click and select "Export -> Export Detail Table" to export all detailed data of the current statistics.
Detail Results
Double-click a row to enter the detail information view. Right-click and select "Export -> Export Current Page Records" to export only the logs on the current page (default 20 records), matching the console’s page display setting. Administrators can change the maximum records per page in the console under "Tools -> Options -> Console Settings -> Log View." Right-click and select "Export -> Export All Records" to export all records.
Exported documents can be saved in four formats: Text (.CSV), HTML, MHT, or Excel.
Print / Print Preview
Generated reports and query results can be printed for record-keeping. Right-click in the data display area and select "Print" to print the current statistics, or "Print Preview" to view a preview before printing.