How to Use Application Statistics in AnySecura | User Guide
This guide will help you unlock the powerful analytical capabilities of the AnySecura Statistics module. You'll learn how to transform raw data on application usage, web browsing, and network traffic into clear, actionable insights for evaluating work patterns and productivity.
We'll walk through the intuitive interface, showing you how to generate user-friendly summaries and detailed reports. You'll be able to confidently query data for specific time periods, groups, or individuals and export these valuable AnySecura statistics to support informed management decisions.
AnySecura generates statistical reports and charts on employees' application usage, web browsing, and network traffic, providing management with insights to evaluate employee work performance.
Application statistics provide powerful analytical capabilities, offering user-friendly summaries and analysis of daily computer activity and application usage. This gives managers reliable data to evaluate employee productivity and includes the ability to export statistical lists.
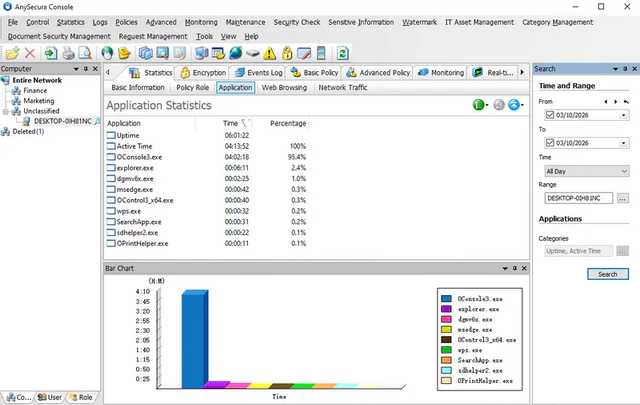
Select the menu "Statistics → Applications" to query application usage for a specific time period by computer (group) or user (group). By default, the system displays statistics for the current day. The application statistics interface is divided into four sections: Computer (User) Tree, Data Display, Statistical Charts, and Query Panel.
Function Button Description
| Icon Button | Description |
|---|---|
 |
Mode button, allowing the administrator to select the application statistics mode. |
 |
Expand button. If an application category has subcategories, clicking this will expand them; for detailed statistics by item, it expands computers or users within a group. Not applicable for detailed application statistics, in which case the icon appears grayed out. |
 |
Display Top Items. Defines the number of entries shown in the statistical list, including All, Top 10, Top 20, or Custom. When expanded columns are set for application categories, this icon is grayed out. |
By default, the statistics include Startup Time and Work Time. Startup Time refers to the running time of the client machine after booting, while Work Time refers to the time during which the keyboard and mouse on the client machine are actively used.
Application statistics can be divided into four modes:
1. Statistics by Application Category
In application categories, administrators can classify all applications used on client machines, making it easier to generate statistics for each category. The statistical results provide insights into employees' daily work and departmental work patterns.
Click the Mode button in the function button area and select Mode → By Category. By default, all application categories will be included. The statistical results are displayed in three columns:
| Field Name | Description |
|---|---|
| Category | The custom category defined in the application classification. |
| Time | The total time client machines spent using applications in this category, sorted by usage time from longest to shortest by default. |
| Percentage | The percentage of work time spent using applications in this category, displayed from highest to lowest by default. |
2. Statistics by Application Name
If you need to calculate the usage percentage of specific applications, select Mode → By Name. This mode lists the total usage time of each application used on the selected computer(s) or group(s) and the percentage of total work time. Statistics by application name are essentially based on application processes. The results clearly show which applications occupy most of the users' work time, providing insights into user productivity.
3. Detailed Application Statistics
Detailed application statistics are similar to statistics by name but are based on the application's description rather than the process. For example, if a user runs two different versions of Google Chrome, both using the process chrome.exe, statistics by name would combine their usage time as chrome.exe. Detailed statistics, however, track each version separately, providing a more precise breakdown.
4. Itemized Statistics
Itemized statistics calculate the usage percentage of different application categories for each computer or computer group. By default, the system tracks boot time and work time. You can add application categories in the Category field of the query panel to include them in the statistics.
For example, to track IM and browser usage for all computers in a group, first select the group, choose Mode → Itemized Statistics, then add the predefined application categories (IM, Browser, etc.) in the query panel and click Query to get the results. If the group contains subgroups, click the Expand button to view statistics for all computers in the subgroups.