Web Browsing Statistics for Non-Work-Related Activity in AnySecura
Understanding non-work-related web activity is key to maintaining a productive and secure network. This guide will show you how the AnySecura Statistics module provides clear insights into these browsing patterns.
You'll learn to navigate the three reporting modes—by category, by website details, and itemized by computer—to effectively track usage. We'll explain how to use the mode, expand, and display controls to tailor the data, helping you identify trends and address potential issues promptly.
Many employees may browse non-work-related websites during office hours. The web browsing statistics feature allows administrators to track users' website activity, enabling timely detection of issues and appropriate actions.
Function Button Description
| Icon Button | Description |
|---|---|
 |
Mode button: Administrators can select the website statistics mode. |
 |
Expand button: Disabled for website details (icon grayed out); if a website category has subcategories, they can be expanded. For itemized statistics, it can expand computers or users within a group. |
 |
Display Top Items: Defines the number of items shown in the statistics list, including All, Top 10, Top 20, or Custom. When expanded columns are set by website category, this icon is grayed out. |
Web browsing statistics can be divided into three modes:
1. By Website Category
Statistics by website category require that administrators first add categories and their website identifiers in "Category Management → Websites." This mode allows for macro-level statistics and analysis of different website categories.
By default, all categories' browsing time is included in the statistics. Websites not assigned to any category are automatically grouped under "Uncategorized." The list is sorted by browsing time, with websites visited for the longest time appearing first.
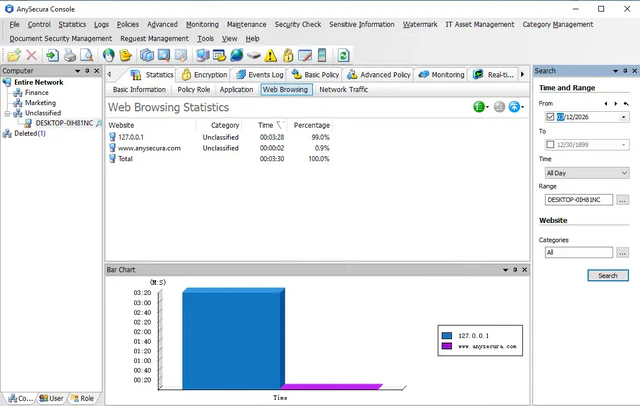
2. By Website Details
Statistics by website details list all visited websites, displaying browsing time for each, typically aggregated by domain. To filter by category, administrators can use the query conditions on the right.
If a website has a name set in the website library, it will display as "Website Name – Website"; if not, the domain name is shown directly.
In detail mode, the expand column function is disabled. By default, all websites are included, and the Top Items button can be used to select a subset for display.
3. Itemized Statistics
Itemized statistics calculate browsing time per computer for one or more website categories. Statistics can be generated for a computer group or the entire network.
By default, uncategorized website browsing time is calculated. Administrators can add or modify website categories in the query panel as needed. Clicking the Expand button will expand all subgroups, displaying statistics for all computers.